
Once you have a tenant app and tenant experience software suite, you can start to capture meaningful data on the people in your buildings.
Here's the problem: After just months of operation, you often find you have more data than you can handle. It can be hard to know, at a glance, which analytics and numbers are the most useful in prescribing improvements to customer service, engagement, or building operations.
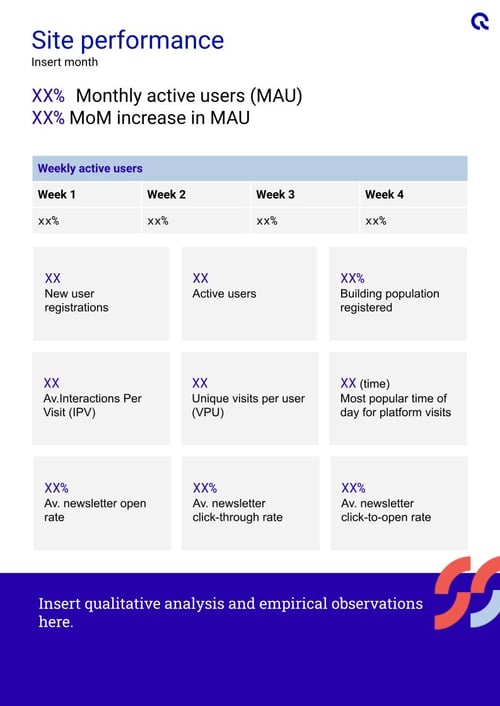
Equiem's Community Managers use the following reporting template as part of our standard Engage services. We track the key metrics listed above and condense them into an easily digestible format for the purpose of aiding our clients with analysis and high-level performance. This template is designed to supplement our clients' regular use of our Analytics Dashboards product — but we've rejigged it slightly to be agnostic, so you can use it with your own analytics solution.
We and our CRE landlord clients are constantly engaged in the process of understanding the tenant of the future, and evolving the standard of tenant experience to suit.
Excerpt: CRE Landlord's Guide to Tenant App Analytics.
How to use this template:
- Follow this link to the Google Sheets file
- Make a copy of the template
- Consult your analytics products to find the data you need
- Try tracking your site performance for three months, and see what you discover!
Equiem's Core tenant experience platform solution includes our Analytics Dashboards product, which provides you all of the analytics you need to access the benefits detailed above. If you want more data, or need ways to optimise your engagement strategy, we can help. Book a consultation with us today.
Topics:
Engage